Author Archives: brightrain

TRACK ALL THE FERRIES

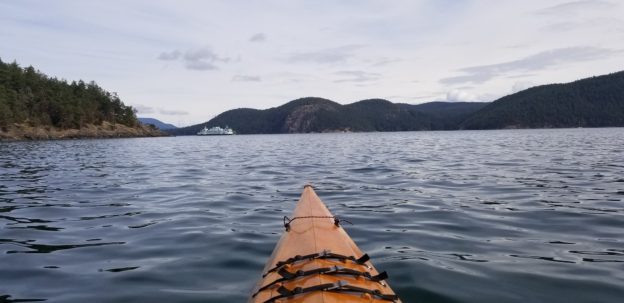
I am absolutely in love with the ferries in Washington State. When we lived there, we would often take a ferry ride as an outing with the kids. We’ve hauled our kids aboard every route in the system at least once. It is truly magical to glide across Puget Sound experiencing the salty air, looking for marine life (Orca!), and soaking in the sound of endless car alarms (if you’ve ridden, you know).

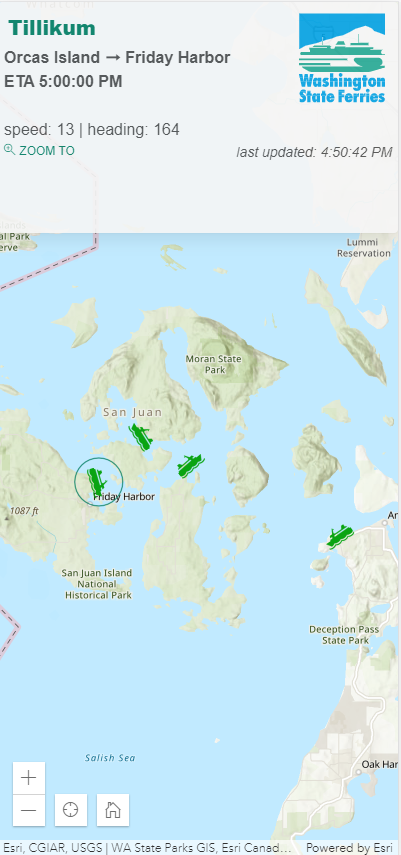
The application is what it says on the package, a web mapping application that shows real-time location and schedule details for individual vessels in the Washington State Ferry System. I consider 8 seconds to be real-time but I know there are sticklers. Locations update every 8 seconds and if you miss your boat due to an 8 second lag you are cutting things way too close my friend.

The Technical Stuff
If you want to dig right in:
CODE
https://github.com/BrightRainSolutions/wa-ferry-tracker

LIVE APP
https://brightrain.com/ferries/

The application was developed using:

  • VUE JS
  • ARCGIS JS API v4 (turned out to be the wrong choice, see below)
  • JQuery (yeah jQuery, don’t @ me, it’s for requests, see below)
  • BULMA

Vue is good. Vue is versatile. I can script tag it in the html doc and still use good ole html while getting all of the crispiness of a reactive component (and it works just fine to declare it within the required arcgis js AMD). No build process, not a bunch of dependencies, simple.

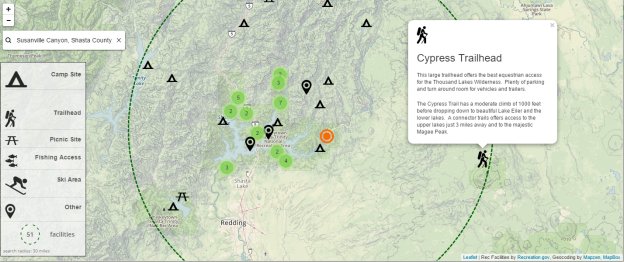
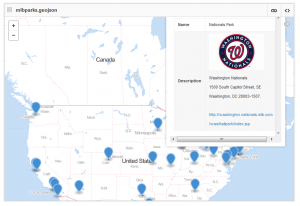
The structure and logic of the app is straight forward. The core is a graphics layers to display individual ferry locations – both position and attribute details get updated every x number of seconds. The first call to the vessel location API creates the graphics and adds them to the graphics layer. A timer is then set to call the function to update the ferries at a set interval (initially 8 seconds). On update, each vessel returned from the API is retrieved from the graphics layer and its position and heading are updated  (icon updated according to heading). If a ferry is selected the info box displays the vessel route details. Bonus – when the update occurs, the info box displaying details for the ferry is seamlessly updated as well.

MOBILE
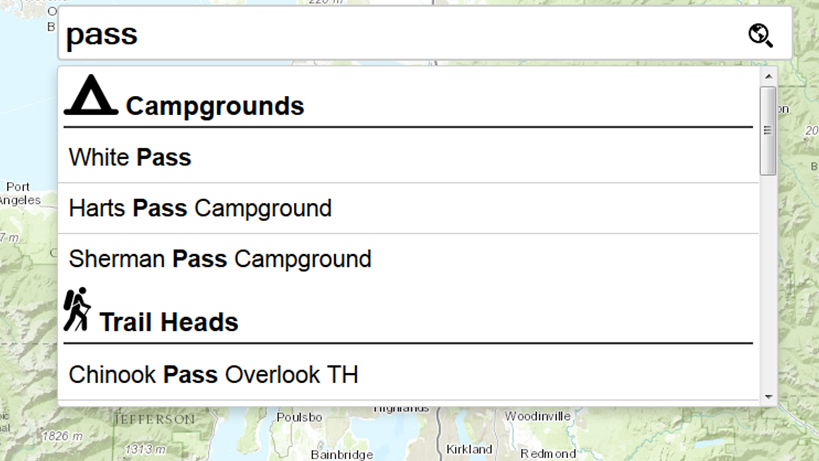
Making an interactive map mobile friendly is challenging to say the least but adding media queries to pin the info box to the top on device screens smaller than 600px provides a workable solution for tracking ferries on mobile devices including tablets and phones.

ferries-mobile

HEADING GRAPHIC

These are the funny things in real-life projects. I probably spent the most amount of time on the ferry graphics themselves. Since the API returns the heading of the vessel, obviously, we want to point it in the right direction with each update. So, the easiest icon to use would be an overhead view of a boat.

so boring

BUT, how boring!

I wanted to show an oblique ferry boat headed in the right direction. SO! In order to do this, I initially created 8 icons for eight possible headings (W, NW, NE, and so on) and then determined which to use based on the given heading (45° = NE):

heading east
heading west

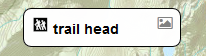
BUT! Realized I could set the angle of the symbol with each position update which would produce a more accurate heading. BUT BUT! You guys….we could end up with upside down boats in certain headings if we used the same image for all headings like this one heading at 270°:  

just not right

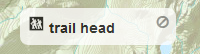
So, I settled on using two images, both pointing north, 0°, but in opposite orientations. This allows for any ferry traveling west, between headings 180 and 360, to use the ‘heading east’ symbol with the correct angle applied and not be upside down(!):

heading west
heading east

A function then determines which image to use based on heading. For example, if our heading is 45°, we use the ferry icon ‘heading east’ and then set the angle of the icon to 45

heading at 45°

The function that is called when a ferry is updated to determine the symbol based on heading:

getFerryMarkerSymbol(heading) {
    // We have two icons defined in our data
    // one for ferrys heading west and another east
    // both oriented correctly
    // so determine which icon to use based on the heading
    // then set the angle of the icon and return it
    if (heading > 0 && heading <= 180) {
        this.ferryMarkers.headingEast.angle = heading;
        return this.ferryMarkers.headingEast;
    } else {
        this.ferryMarkers.headingWest.angle = heading;
        return this.ferryMarkers.headingWest;
 }}

It takes a certain amount of stubborn patience to work out these kind of UI details. But I am here for it.
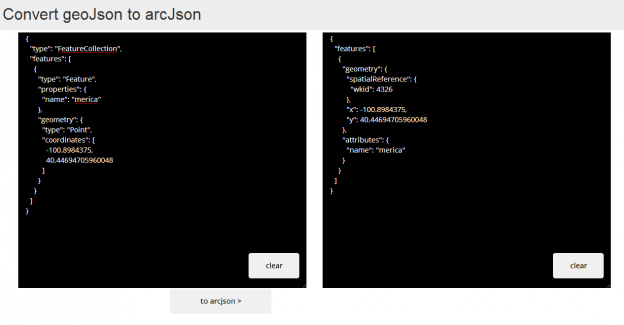
THE WRONG TOOL

I am obsessed with using the right tool for the job (ask my daughter about my browbeating regarding which knife to use for which cutting job). I could have used a simpler mapping API. I was trying to take advantage of the rotational symbol renderer in a client-side feature layer within the arcgis js api, but the update process for feature geometry was incredibly cumbersome. Basically, the API treats each update as an edit and requiring a chain of promises to have it propagate to the actual feature location in the interface. So. I didn’t end up using a client-side feature layer that could actually use the rotational renderer and simply used a graphics layer. Which any simpler APIs could do, such as (esri-)leaflet.

CORS NOT COORS

After hours struggling with CORS issues with various attempts at implementing CORS Anywhere, I discovered I could use JSONP to make the request. However, the native fetch does not support jsonp, so I went with jQuery to make the jsonp request. Cheers!

OPEN DATA

I’m a big believer in OPEN DATA and this application is a great example. Big shout out to Washington State Department of Transportation for not only the data, but an active service that provides real time vessel locations and schedule details.

VIA API

As web GIS eats the custom geo application world, one holdout is consuming outside APIs for custom applications. If you want to include dynamic data from disparate systems you need to build it yourself, for now. And I remain open to being proven wrong here.

I discovered the Washington State Department of Transportation (WSDOT) Traveler Information API, which includes the specific State Ferries Vessels API, and went to work to develop the real-time-tracking because why? I just love the ferries.

Please open this on a ferry ride soon and let me know what you think!

arcgis js 3D camera setter

ArcGIS JS 3D Camera Setter

tl;dr
A simple way to grab arcgis js 4.x 3D camera json by copying the current camera state to your clipboard:

http://dev.brightrain.com/camera-setter/

code here

https://github.com/BrightRainSolutions/arc-camera-setter


Moar

I’m building a 3D mapping app using the ArcGIS JS 4.x API that requires a new 3D camera position for each instance. This presented a funny problem because it is rather tedious to capture a specific camera position. Unlike a simpler, 2D map, in which you only have to set an extent or a center point with zoom level, a 3D camera has more variables that require you to take a pilot’s view of the earth. You need to set the position of the camera including coordinates and height, as well as the tilt of the camera and it’s heading.

While it’s kind of fun to just tweak it and refresh the page to get it just right, it takes a lot of tweaking!

So I built a simple tool that captures all of the properties of the camera and formats it in the json required to set the view of your 3D map and copies it to your clipboard.

It’s simple! A camera json object is created for the current 3D map view and displayed in the right panel. The copy button copies the json to your clipboard for direct use in your arcgis js 3D map view (sceneview). Just paste it right into your code.

Give it a try here

http://dev.brightrain.com/camera-setter/

and you can find the code here

https://github.com/BrightRainSolutions/arc-camera-setter

It includes a sample feature service for reference, but obviously you don’t have to. The 3D scene will work just fine.

Also, this could be used to create tour by using a series of camera positions, for example. (Potential future post…)


Stuff used

arcgis js api 4.x

clipboad js

icon from Icons

Road to GIS

On this inaugural GIS Appreciation Day: Following great stories by Gretchen Peterson and Bill Dollins >

My Road to GIS

I am absolutely fascinated by the various paths that lead nerds of all types to GIS. From natural sciences, social sciences, science fiction, art, wanderers of all kinds stumble upon GIS and decide to stay. Me too. Some use it as a tool to further their pursuits, others make it their career. It blends so many worlds (pun intended) that it casts a wide net and yields an interesting haul. It certainly blended four perfect worlds for me: Sociology, The Great Outdoors, Maps, and Magic.

My road to GIS started with a simple question: What is your home zip code? Little did I know how this one question would affect not only my career, but my life.

My four worlds

First, I am absolutely fascinated by people and society. So naturally I studied Sociology. Initially I had little interest in technology outside of using a word processor to write my papers and print them (yes, dot matrix). I was a social worker helping homeless mentally ill people in my hometown for five years while I finished a two year college degree. I was an idealist who was certain to save the world.

Before that happened however…and before I thought my spirit would break…I split to Alaska to “Find Myself” and to experience the thrill and serenity of the Great Outdoors. I got my copy of The Milepost and a giant fistful of maps and headed to Alaska via the famous ALCAN Highway. Suffice it to say I learned how to effectively use and respect Maps in Alaska, among other things. When it was time to return to the Lower 48 I just couldn’t bring myself to move back to the midwest, so I moved to Colorado.

Upon moving to Colorado (the first time), I was thrilled to land a job with Colorado State Parks while finishing my degree in Sociology at Colorado State University. I was able to apply my new found quantitative research skills in conducting and reporting on the Colorado State Parks Visitation Study. In analyzing the results, one question seemed to jump off the page. What is your home zip code? Simple enough, but with so many possibilities. But I just didn’t know how to analyze it. I could have looked for recurrences of the same zip code in a table, but that misses so much. How could I display this data in a useful and interesting way? I started to ask around and stumbled into those sacred three letters for the very first time: G. I. S.

Intrigued, I got a shapefile of all zip codes in the US (from what seemed to be some kind of ogre who hung out in a dark corner of our Stalin-era Denver State Building hacking commands into a blinking cursor in a black box on a Unix workstation). I then figured out how to join this shapefile to my list of zip codes and the world was never the same for me again. I had created my very first data driven map. There I had it, the merging of all the things I loved in the world: Sociology, The Great Outdoors, and Maps!

I quickly realized that what I had stumbled into was happening all around me at CSU. But not in the liberal arts college. I quickly signed up for my first GIS class and eventually earned a minor in Geography by conducting a comprehensive trail use study at Castlewood Canyon State Park that included everything from trail mapping with GPS to conducting personal interview surveys, compiling, and analyzing the results. And making maps of which trails hikers hiked.

In younger years I had very little interest in technology. In fact, I had a fascination with the Unabomber Manifesto decrying technology and its’ affects. But my encounter with GIS piqued my interest in technology enough to dig in a little. And with a proclamation from a GIS friend at the USGS that “Dude, if you’re going to do GIS you need to learn to code!” Dude, peeeeshaaw, was my reaction, as if he just insulted my first map. But, once I figured out how to control an entire stack of technology to make and control a map, it was Magic. And I was hooked on programming.

I have since made a career using all of these and all of them combine to keep me interested, engaged, and…well…employed. GIS is a journey that I couldn’t have planned for, but in the end, it fits so perfectly.

For giggles, although I still appreciate the simplicity, my first ‘published’ map:

castlewood canyon trail map survey

Recreation Facilities around Lassen Volcanic National Park

outdoorsy-nerds

Come git it outdoorsy nerds! Recreation facilities for all (developers)!

The Recreation Information Database (RIDB) is a comprehensive database containing authoritative outdoor recreation facility information for most US federal agencies that provide recreation services including the National Park Service, US Forest Service and many, many others.

I’ve been following the progress since its inception and when the USDA came out with an API to access it I dove in to make a web map to access recreation facilities, from a map.

The application is pretty straightforward. You can pan and zoom the map and recreation facilities will be display with recognizable icons within the current extent or, if zoom level is far out, a predefined radius based on zoom level. Clustering keeps things tidy. I also used the Mapzen Search service along with the Mapzen Leaflet Geocoder to provide autocomplete search capability.

Give it a try here:

http://dev.brightrain.com/recreationer/

Source project:

https://github.com/brightrain/ridb-recreationer

The Services:

Recreation Information Database API

Mapzen Search (geocoding API)

The Stack:

Leaflet

Leaflet marker cluster

Mapzen leaflet geocoder

Leaflet locate control

Mapbox for basemap

map-autocomplete

Autocomplete Map Search:

Autocomplete multi-source Search with ArcGIS REST services

Search First. Search is expected in modern web applications. And what better use of a map application than to start typing what you want, be shown a list of relevant suggestions, pick one and be taken there with potentially some useful context info.

In several posts in the great geospatial blog, MapBrief, Brian Timoney has mentioned a Search First approach to web application building. The most recent example:

Good Thing #1: A Big, Obvious Auto-Complete Text Entry Box

I couldn’t agree more. It is core to nearly every application I build and is of far greater use than most of the novelty web mapping ‘standard’ tools <uhem, looking at you, measure tool>.

Search is the number one request I get in web mapping applications so I thought I’d share how I put all the pieces together to get an autocomplete search up and running with esri ArcGIS REST services.

I’ll walk through the steps to get a fully functioning autocomplete map search feature.

Here’s the source on github and a working sample application.

Let’s build an autocomplete search box for recreation sites in Okanogan-Wenatchee National Forest.

This autocomplete solution uses twitter typeahead js, the bundled download includes the bloodhound suggestion engine and the jQuery plugin, all of which we’ll use here.

Once you get typeahead all hooked into your application, the only html you’ll need is an input for your search and the rest is done via javascript.

<input id="search-box" type="text" placeholder="Search...">

There are three parts to getting things going:

  1. Define and initialize suggestion engines
  2. Wireup typeahead with jQuery including adding the engines and defining the UI
  3. Handle the event when a user selects one of the suggestions

Define the Engines

First, we’ll define an engine (bloodhound) for each source to include. In this example we’ll use four:

 icon-camp

A campground (arcgis) feature service layer

 icon-trail

A trail head feature service layer

 icon-ski

A ski area feature service layer

 icon-map-marker

The esri geocoder service


Construct the remote source(s)

This is the most critical piece of the whole operation and requires some consideration because you potentially have options here. The remote source needs a url to send a request each time the user types characters. Selecting the best option will result in the best performance. Here are our best options with arcgis REST services:

find

If you have a map server, find is a great option if you want to search multiple layers in the same request. I’d say if you have this option, take it.

query

If you only have a feature server, this is for you. You can either query a layer individually or query the entire feature server. We are going to query each of our feature layers individually.

suggest

Suggest is currently meant for geocoding, for now, but I suspect a locator service could be constructed to take advantage of this service. I’ll make the assumption that this is the best option because it is intended specifically for search.

You could roll your own locator service that supports suggest (ArcGIS 10.3 +). We’ll use the world geocoder and take advantage of suggest.

The code to build the campground site suggestion search engine and initialize it:

Here’s the engine setup for the esri world geocoder service. Note the searchExtent parameter. This can be used to limit the geographic area of you suggestion results. In this case it is (roughly) Washington State.

You can see that in both of these engines we set the ajax property to show the spinner before the request and remove it when the request is complete. These calls can step over each other if you have several engines but works pretty well here.


Add the engines and style the suggestions

Now we need to setup typeahead itself and wire up the engines and tell typeahead the properties we are using for each suggestion generated by the engines. We will also define how the suggestions will be displayed in the drop down.

First, turn the input box into a typeahead via jQuery and set some options like so

minLength is the number of characters a user types before suggestions start firing.

Next tell typeahead about the engines to use, here’s our campground setup

We’ve just told typeahead that the name of this source is ‘camp’, the displayKey is ‘name’, the source is our camp bloodhound engine adapter and set the template to use for the header (a campground icon inside a header tag).

You’ll do the same for all sources chaining them together. The whole set of sources looks like this:

Define what will happen when a user selects a suggestion

Okay, cool, we’ve got some suggestions for our users.

suggestions-ahead

Now we need to setup what will happen when one is actually selected. So we simply set up a jQuery event handler and chain it to our typeahead declaration. the event will pass the callback function the element and the selected datum (generated from the engine).

For the feature service layers we have set the datum to include the objectId (see the filter function in the bloodhound engine definition). This allows us to fetch the feature along with its’ geometry via another ajax call. We can then get attributes, zoom to it, make another call to get more info, whatever you want. In this sample we simply zoom to it and put a text label displaying the name right on the map.

For the geocoder a name and ‘magicKey’ are defined in the datum which allows us to call back to the service to retrieve the feature via a call to the find REST end point. For this one we simply zoom to the extent returned. Here’s the whole event handler:

That’s it, complete autocomplete.

You have an incredible amount of control over display via css as well. Here is what I’ve used in the sample app:

There are many more options available to you in this solution so please review the documentation for further info. I am very impressed with the flexibility of typeahead so if this setup doesn’t quite work for you I suspect there are ways to get it going.

BTW, If you are using esri-leaflet you can use the great geocoder plugin that also allows you to search via a geocoder service as well as map and feature services like we’re doing here.

Finally a shout out to Bryan McBride for his excellent mapping template, bootleaf, that I used as a starter for this solution.

The whole project is in a github repo here

https://github.com/brightrain/arcgis-autocomplete

And you can see it in action here

http://dev.brightrain.com/map-autocomplete

Togglability

Togglability
Many of the desktop GIS paradigms have unfortunately made their way to the web. Second only to the ‘Identify’ tool in popularity, the checkbox for toggling layers is still the most common way to turn map layers on and off. While I appreciate the simplicity it just doesn’t seem all that, well, elegant. And now that skeuomorphism is out and flat design is here to stay, the good ole checkbox might just be going the way of

This doesn’t hurt my feelings but it does leave some interesting voids and presents lots of possibilities.

Here’s my first departure from the old paradigm that I’m using pretty regularly. A sized
< div > floating directly over the map with some roundy edges and applying slight transparency. Position these togglable layer elements in a corner or off to the side and they work pretty well.
visible
visible
not-visible
not-visible
dual purpose layer toggler and legend
togglable-layers

Styling
Set the css hover to cursor: pointer and change the background color and it becomes obvious that you can interact with it. Adding an icon can be used to invite users and indicate what it does. This allows you to maximize space by using the element for both togglability and as a legend. Moving the element into the background by lightening the background color, removing the border and changing the icon indicates its in-visibility. Conversely, applying a solid border, increasing opacity and swapping icons give the visual cue that this thing is live.

the css:

Toggling
Wire up a click event for each togglable-layer element to toggle the visibility of the layer on the map and also to toggle css classes that visually indicate the visibility state of that layer.

the js:

You can see this in action,
demo of togglable layers
using recreation sites at Wenatchee National Forest

Source of demo on github.

I realize that there is a growing contingency of ‘no GIS’ proponents who would do away with the concept of turning layers of data on and off and, in some contexts, I agree. But there are many use cases where this can be extremely powerful and, if done well, dare I say, elegant.

Updated geoconverter: { geoJson } <> { arcJson }

I put together a simple geo-converter a while back (and posted about it) that converts geojson to arcjson\esrijson. I needed it to get some polygons in an arcgis feature service. I have updated that converter to also convert from arcjson to geojson as well. I used it to pull arcjson from an ArcGIS Feature Service via a query against the REST API and convert the results to geojson.

The geoconverter tool
http://brightrain.github.io/geoconverter/

source

I pulled the arcjson formatted data from City of Fort Collins ArcGIS web services

A query against the Neighborhoods layer, like so:
http://gis.fcgov.com/FTCArcGIS/rest/services/FCMaps/MapServer/17/query?returnGeometry=true&geometryType=esriGeometryEnvelope&geometry={%22xmin%22%3a-122%2c%22ymin%22%3a40%2c%22xmax%22%3a-80%2c%22ymax%22%3a50%2c%22spatialReference%22%3a{%22wkid%22%3a4326}}&inSR=4326&spatialRel=esriSpatialRelIntersects&where=%28HOODDESC+IS+NOT+NULL%29&outSR=4326&outFields=*&f=json

Results into the geoconverter

geo-arc2

Created a MapBox map with it

fchoods

And here’s some geojson to try out, Major League Baseball Stadiums
mlb
raw data

Play ball!

geoJson > arcJson

So I put together a dead simple interface to convert geojson to arcjson using the esri geojson utils repo on github. I also threw in a feature to view it on a map, but its spotty…

brightrain.github.io/geoconverter

source available

It truly is a wrapper around geojson utils.

Include, create, use

I ended up doing this for a few reasons: I wanted to try out the awesome geoJson creation and editing tool by @tmcwgeojson.io. And I also wanted to play with the new Boostrap 3 flatness, a significant departure from the old version in both workings and looks.

The idea hit me when I found myself in need of a course polygon dataset representing world regions and I wanted to be able to publish them to a map service for use in an ArcGIS Javascript API application. It was super simple to create the handful of regions I needed with geojson.io and I ended up with geoJson polygons in just a few minutes. I then needed to get them into an ArcGIS feature service. Uh oh, although it’s looking increasingly imminent, geoJson is not supported in the ArcGIS world currently. So here we are.

The new developers.arcgis.com allowed me to quickly create and publish a new feature service to contain the new data. I just copied the output from geojson.io, pasted it into a text box, hit the button and I had arcJson. Another copy and paste to get it into the feature service rest endpoint, addFeatures and I had my regions in my map service.

A note that if you need the same workflow you need to ‘unwrap’ the output arcjson into just the array of features i.e. remove the outter ‘features’ object before pasting into an addFeatures end point. Peel off this bit here and the very last curly too:

stripfeatures


Definitely ‘innovation time’ as this is just a bridge across the open water until esri provides full support for geojson. Let me know if you find it useful.