Tag Archives: map

Recreation Facilities around Lassen Volcanic National Park

outdoorsy-nerds

Come git it outdoorsy nerds! Recreation facilities for all (developers)!

The Recreation Information Database (RIDB) is a comprehensive database containing authoritative outdoor recreation facility information for most US federal agencies that provide recreation services including the National Park Service, US Forest Service and many, many others.

I’ve been following the progress since its inception and when the USDA came out with an API to access it I dove in to make a web map to access recreation facilities, from a map.

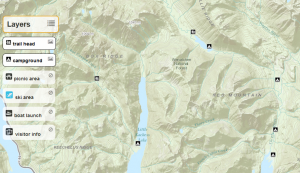
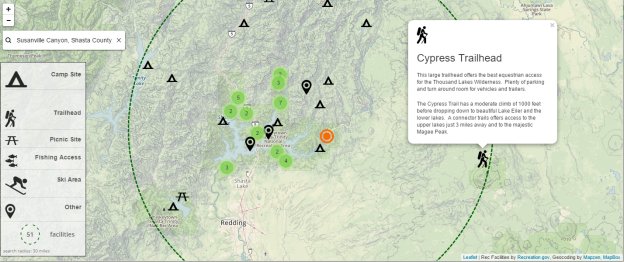
The application is pretty straightforward. You can pan and zoom the map and recreation facilities will be display with recognizable icons within the current extent or, if zoom level is far out, a predefined radius based on zoom level. Clustering keeps things tidy. I also used the Mapzen Search service along with the Mapzen Leaflet Geocoder to provide autocomplete search capability.

Give it a try here:

http://dev.brightrain.com/recreationer/

Source project:

https://github.com/brightrain/ridb-recreationer
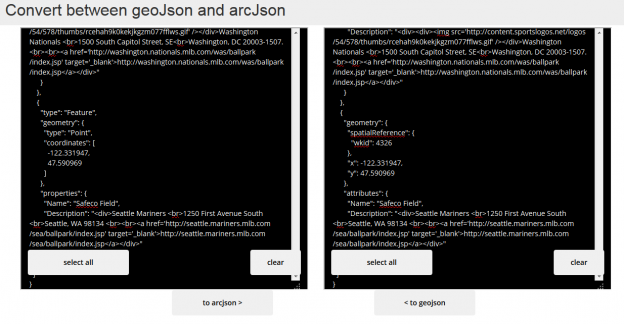
The Services:

Recreation Information Database API

Mapzen Search (geocoding API)

The Stack:

Leaflet

Leaflet marker cluster

Mapzen leaflet geocoder

Leaflet locate control

Mapbox for basemap

Togglability

Togglability
Many of the desktop GIS paradigms have unfortunately made their way to the web. Second only to the ‘Identify’ tool in popularity, the checkbox for toggling layers is still the most common way to turn map layers on and off. While I appreciate the simplicity it just doesn’t seem all that, well, elegant. And now that skeuomorphism is out and flat design is here to stay, the good ole checkbox might just be going the way of

This doesn’t hurt my feelings but it does leave some interesting voids and presents lots of possibilities.

Here’s my first departure from the old paradigm that I’m using pretty regularly. A sized
< div > floating directly over the map with some roundy edges and applying slight transparency. Position these togglable layer elements in a corner or off to the side and they work pretty well.
visible
visible
not-visible
not-visible
dual purpose layer toggler and legend
togglable-layers

Styling
Set the css hover to cursor: pointer and change the background color and it becomes obvious that you can interact with it. Adding an icon can be used to invite users and indicate what it does. This allows you to maximize space by using the element for both togglability and as a legend. Moving the element into the background by lightening the background color, removing the border and changing the icon indicates its in-visibility. Conversely, applying a solid border, increasing opacity and swapping icons give the visual cue that this thing is live.

the css:

Toggling
Wire up a click event for each togglable-layer element to toggle the visibility of the layer on the map and also to toggle css classes that visually indicate the visibility state of that layer.

the js:

You can see this in action,
demo of togglable layers
using recreation sites at Wenatchee National Forest

Source of demo on github.

I realize that there is a growing contingency of ‘no GIS’ proponents who would do away with the concept of turning layers of data on and off and, in some contexts, I agree. But there are many use cases where this can be extremely powerful and, if done well, dare I say, elegant.

Updated geoconverter: { geoJson } <> { arcJson }

I put together a simple geo-converter a while back (and posted about it) that converts geojson to arcjson\esrijson. I needed it to get some polygons in an arcgis feature service. I have updated that converter to also convert from arcjson to geojson as well. I used it to pull arcjson from an ArcGIS Feature Service via a query against the REST API and convert the results to geojson.

The geoconverter tool
http://brightrain.github.io/geoconverter/

source

I pulled the arcjson formatted data from City of Fort Collins ArcGIS web services

A query against the Neighborhoods layer, like so:
http://gis.fcgov.com/FTCArcGIS/rest/services/FCMaps/MapServer/17/query?returnGeometry=true&geometryType=esriGeometryEnvelope&geometry={%22xmin%22%3a-122%2c%22ymin%22%3a40%2c%22xmax%22%3a-80%2c%22ymax%22%3a50%2c%22spatialReference%22%3a{%22wkid%22%3a4326}}&inSR=4326&spatialRel=esriSpatialRelIntersects&where=%28HOODDESC+IS+NOT+NULL%29&outSR=4326&outFields=*&f=json

Results into the geoconverter

geo-arc2

Created a MapBox map with it

fchoods

And here’s some geojson to try out, Major League Baseball Stadiums
mlb
raw data

Play ball!