INTERSECTING SWING STATION
I took up biking last year and I do not wear headphones on a bike. So, I have a lot of time to think.
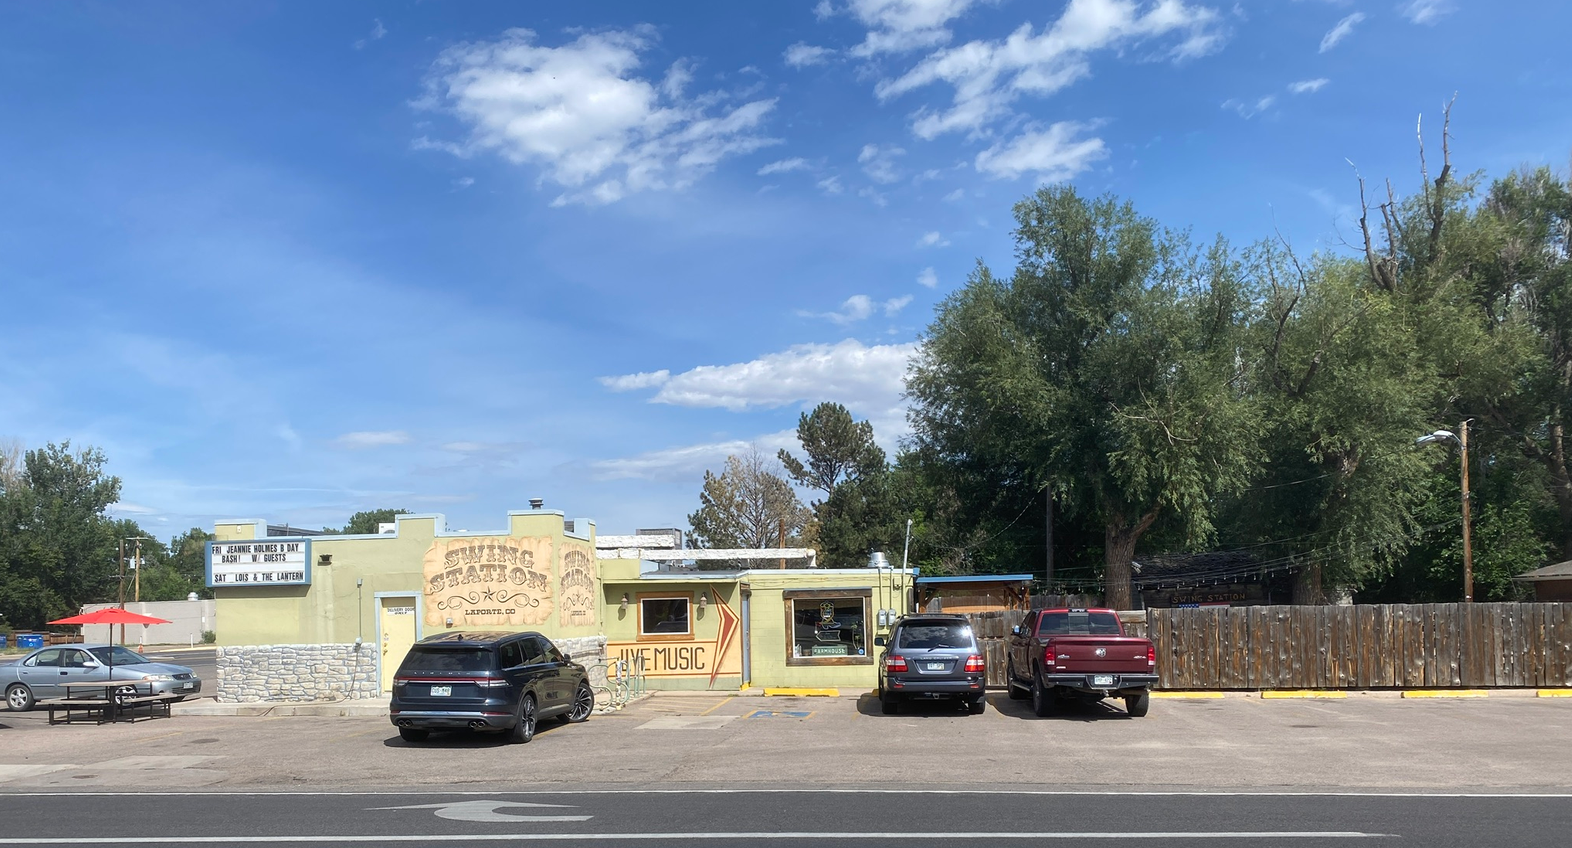
On a recent ride, I passed the infamous Swing Station, “Laporte’s Finest Honkytonk…” where, if you arrive by bike, you get a $1 discount on all draft beer. It’s a great place.
I wondered how many times I’d passed it since I started riding. I devised a rough process for figuring it out. Then I thought let’s try it a ‘modern’ way. Let’s use AI. Geo AI. I named the ride Intersecting Swing Station, of course.
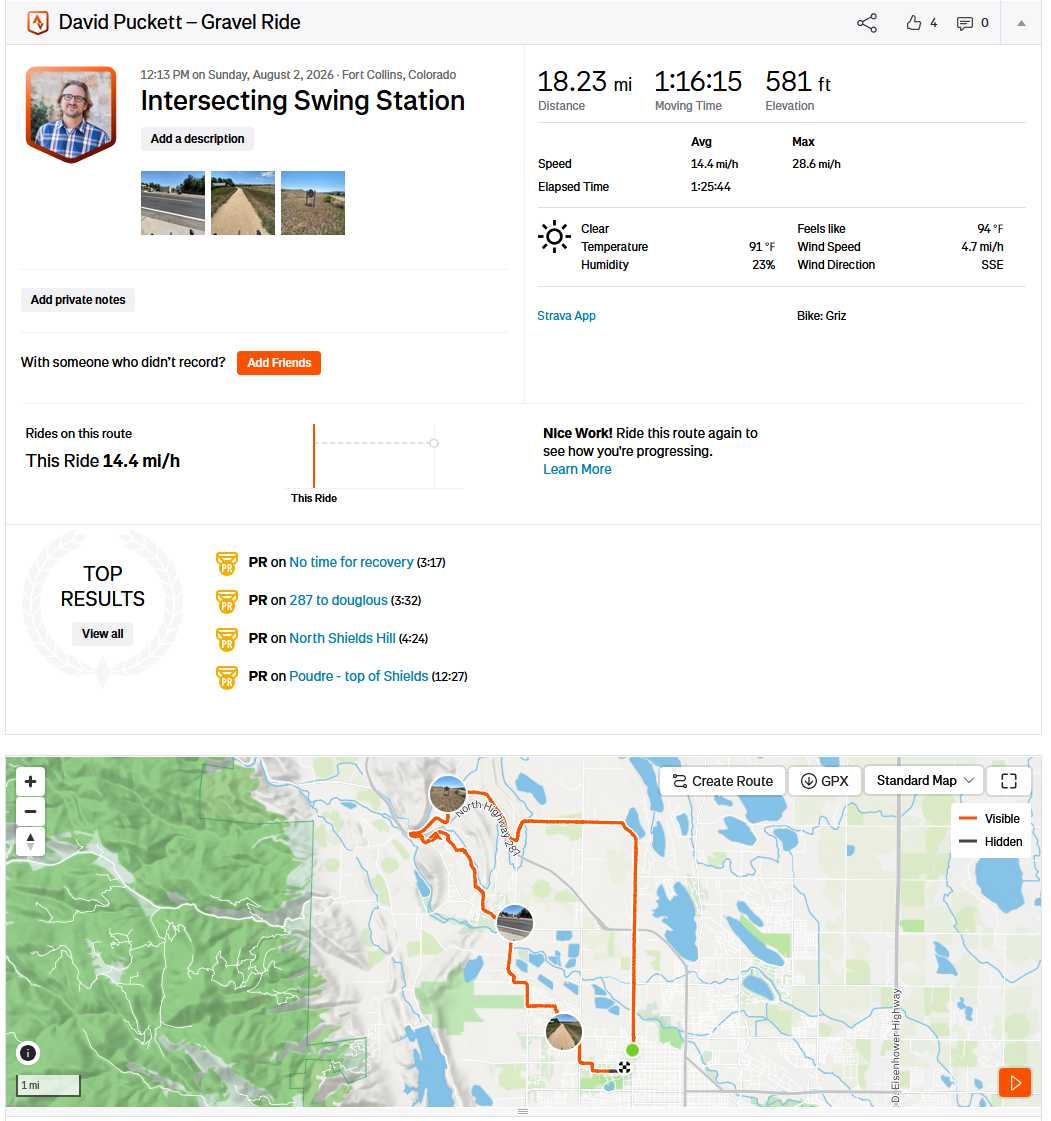
Post-ride, I gave Claude the question and the context, including that I recorded my rides with Strava and have access to the Strava API and MCP.
WHAT CLAUDE DID
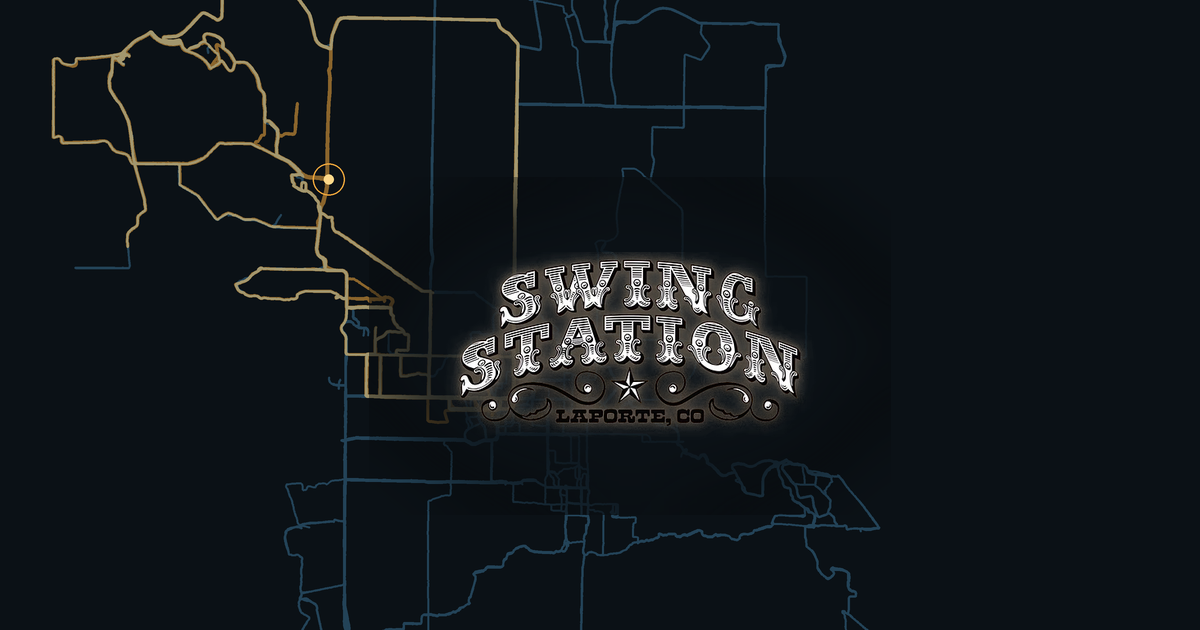
After some deliberation on technique, we decided that a buffer was the right solution. So it derived the perfect buffer to avoid false positive passes and also not miss any. We went back and forth with a couple spots that I rode often and were close but NOT within sight. Neither the Poudre Trail nor Rawhide Drive puts you within eyeshot of Swing Station, for future reference. We ended up with a 250 meter radius. I then fed it the Strava activity download that contains all gpx files and it used Shapely to run the analysis and created this HTML result:
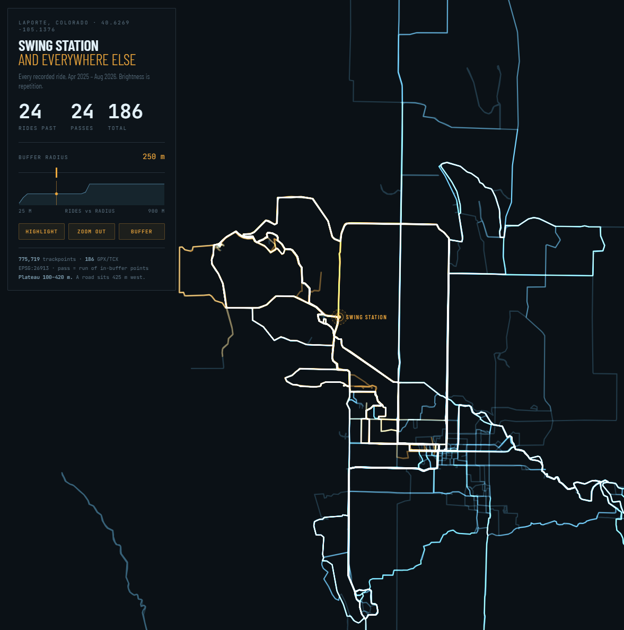
Pretty nice. And correct. 24.
WHAT I DID
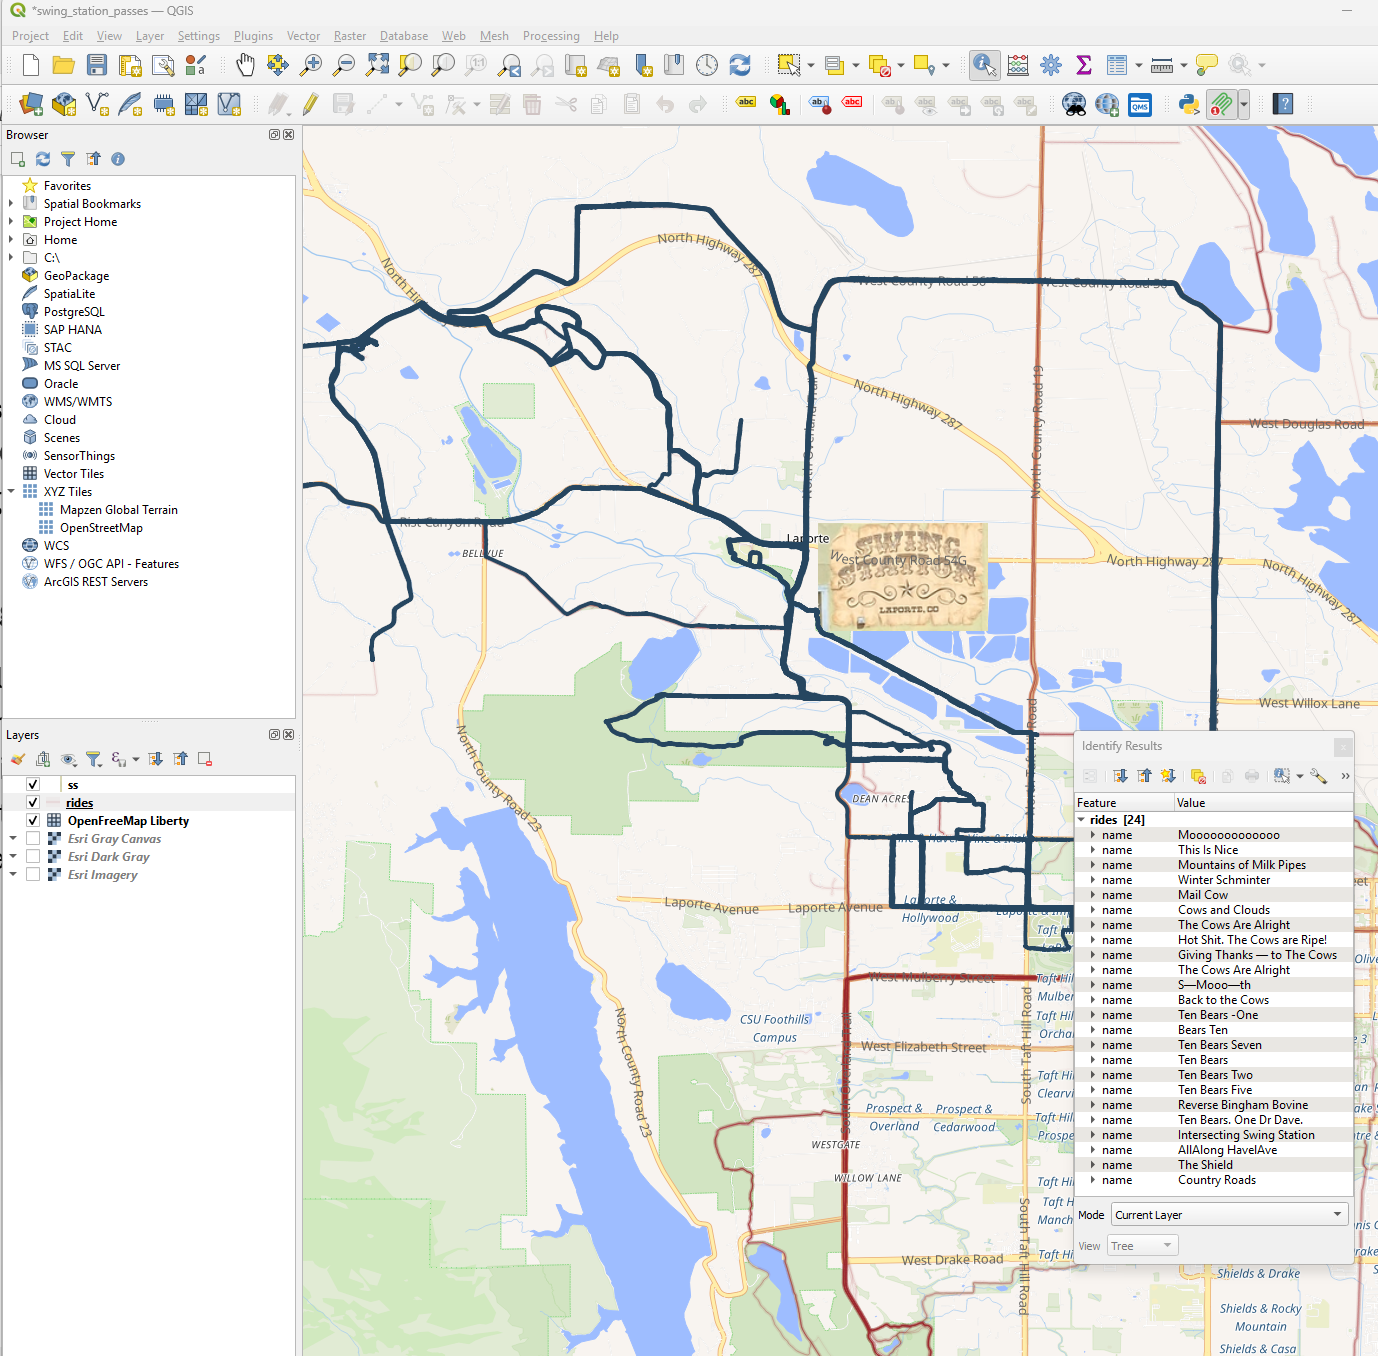
I asked Claude for the command to use GDAL to convert the GPX files I downloaded from Strava to a GeoPackage. Then I dropped the GeoPackage directly onto a map in QGIS. I then used the Identify tool to draw a simple box around the Swing Station intersection. 24. The number of individual routes selected was 24, which meant I had ridden by Swing Station exactly 24 times.
THE LESSON(S)
Just look at it with your own eyeballs.
Truth is, this isn’t really a story about using AI vs not-using-AI. It’s a story of using non-visual tools and the terminal vs using interactive and visual tools like QGIS. That’s all Claude did: use python tools in a container environment. And without seeing the routes it deduced the logic required. And got the right answer.
I got the right answer in 5 seconds by selecting a tool and drawing a box.
Teasing out what was actual AI use and what was non-visual tool use seemed important to the exercise. Claude really just drove Shapely and used GDAL for the data work. Sure, it also helped think through the problem, but honestly it overthought the problem. It (we) went way down a rabbit hole about determining the right buffer size when the buffer we really needed was a rubber band selection with the Identify tool(!).
Sometimes, just look at it first.
Here, have a look: