
TRACK ALL THE FERRIES
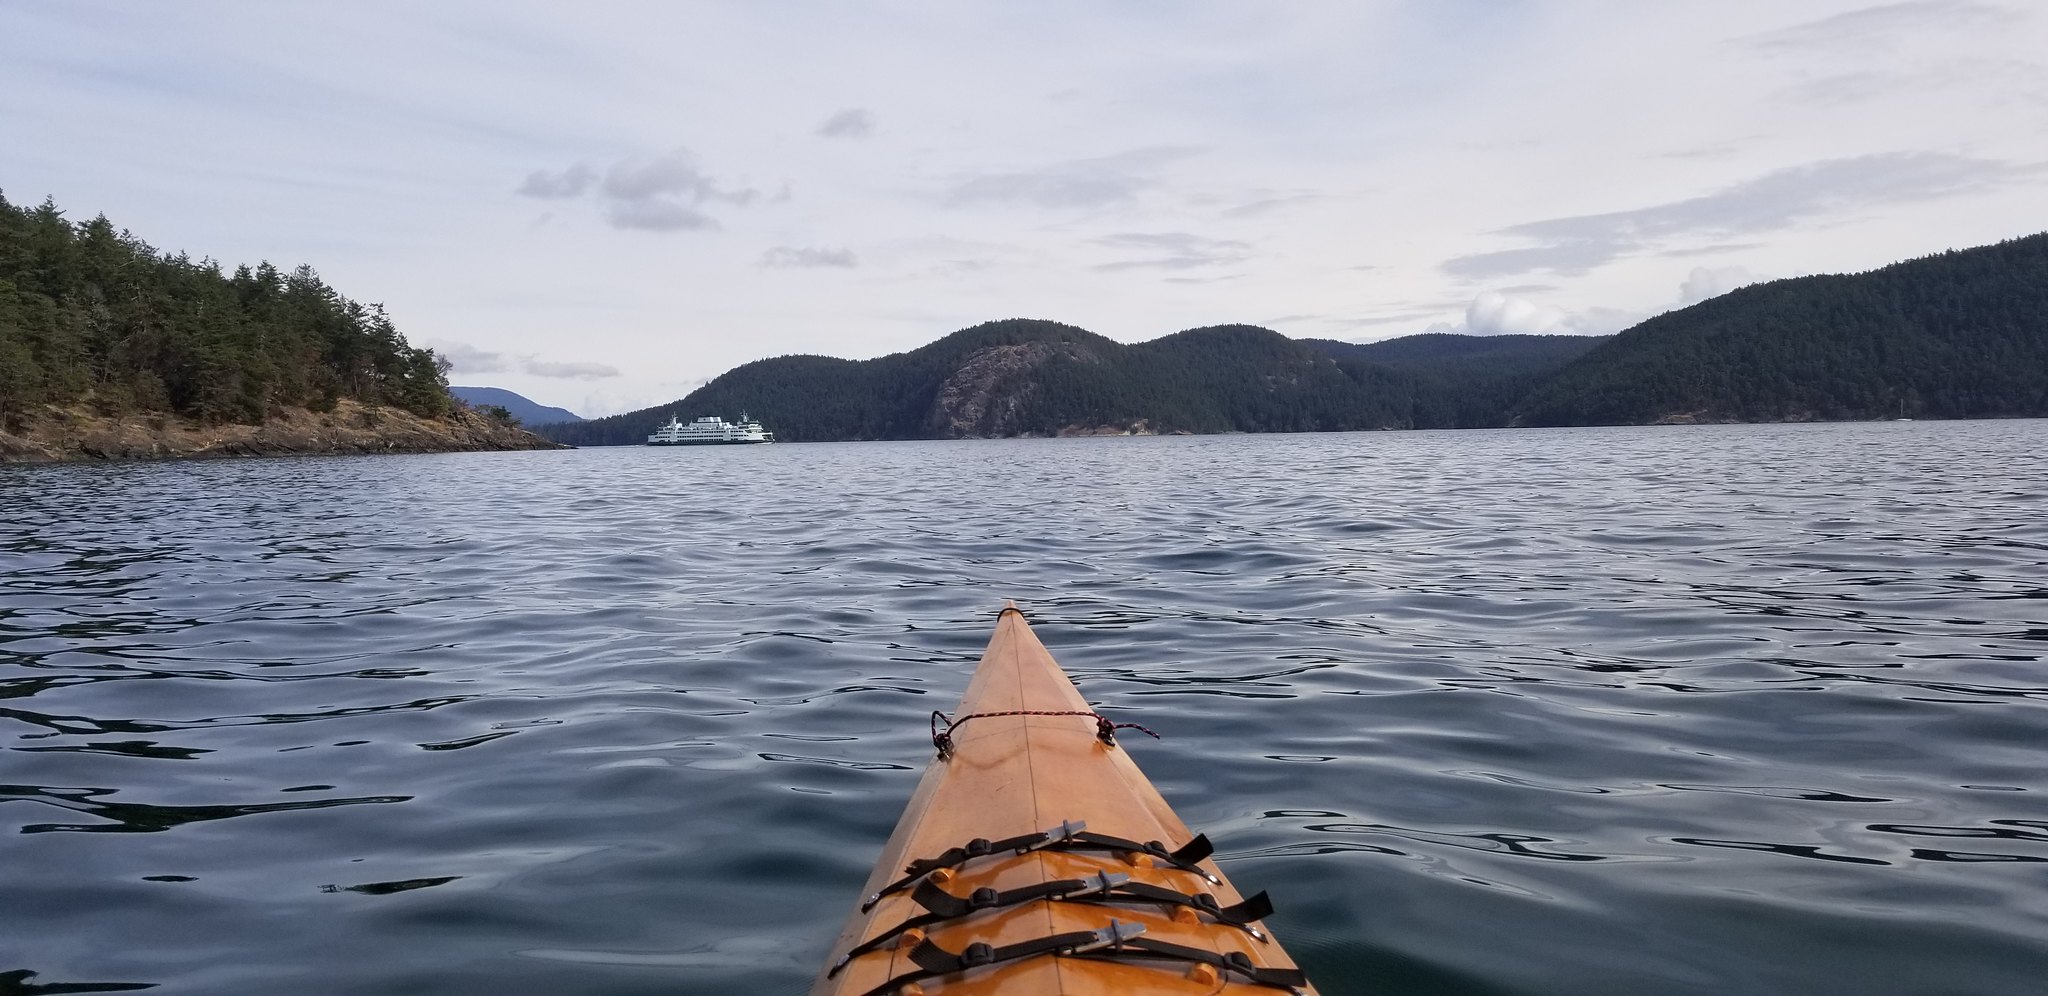
I am absolutely in love with the ferries in Washington State.
When we lived there, we would often take a ferry ride as an outing with the kids. We’ve hauled our kids aboard every route in the system at least once. It is truly magical to glide across Puget Sound experiencing the salty air, looking for marine life (Orca!), and soaking in the sound of endless car alarms (if you’ve ridden, you know).
The application is exactly what it says on the package: a web mapping application that shows real-time location and schedule details for individual vessels in the Washington State Ferry System. I consider 8 seconds to be real-time — and if you miss your boat because of an 8-second lag, my friend, you are cutting it way too close.
The Technical Stuff
If you want to dig right in:
CODE
https://github.com/BrightRainSolutions/wa-ferry-tracker
LIVE APP
https://alltheferries.com/
The application was developed using:
Vue.js
ArcGIS JS API v4 (which turned out to be the wrong choice… see below)
jQuery (yes, jQuery — don’t @ me, it’s for JSONP)
Bulma CSS
Vue Is Good. Vue Is Versatile.
I can script-tag Vue into the HTML doc and still use plain HTML while getting all the crispiness of reactive components (and it works fine inside the ArcGIS JS AMD environment).
No build process. No dependency explosion. Simple.
The core of the app is a graphics layer that shows each ferry’s location — both position and attributes update on a timer (initially 8 seconds). The first API call creates the graphics; subsequent calls update each vessel’s geometry and heading. If a ferry is selected, the info box shows route details and updates seamlessly on each refresh.
Mobile
Making an interactive map mobile-friendly is… challenging.
Media queries anchored the info box at the top for screens < 600px, which ended up being a workable tracking view for phones and tablets.
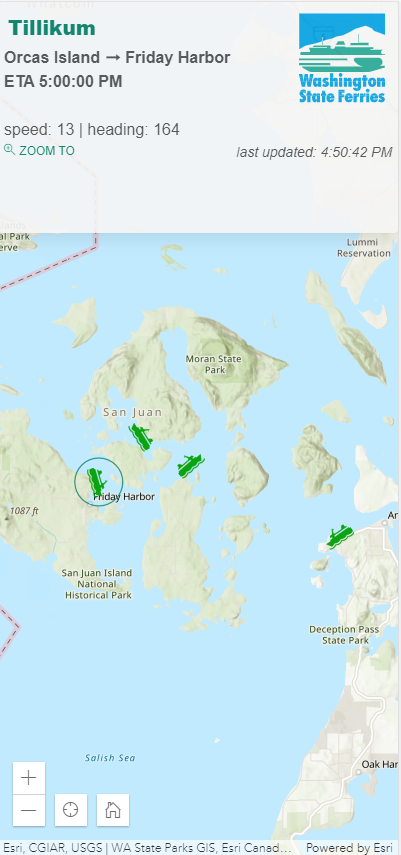
Heading Graphic
This is where real-life UI dev gets weird.
I spent way too much time on the ferry graphics.
The API returns the vessel heading, so naturally we want the icon to rotate to match.
The obvious icon is a top-down boat. But… snooze.

I wanted an oblique ferry icon pointed in the correct direction.
So—attempt one: create 8 icons for the compass directions and use the right one based on heading.


But then I realized the symbol angle could be set dynamically — great!
Except… in certain headings the icon turns upside down. Absolutely cursed.

So the final solution:
Two icons, both oriented north, but mirrored.
Headings from 0–180 use the “east” icon, and headings from 180–360 use the “west” icon, with the angle applied.


A simplified version of the symbol logic:
getFerryMarkerSymbol(heading) {
    if (heading > 0 && heading <= 180) {
        this.ferryMarkers.headingEast.angle = heading;
        return this.ferryMarkers.headingEast;
    } else {
        this.ferryMarkers.headingWest.angle = heading;
        return this.ferryMarkers.headingWest;
    }
}
It took stubborn patience to iron all of this out. But I am here for it.
The Wrong Tool
I obsess over using the right tool for the job.
I could have used a simpler mapping API.
I originally tried to use the ArcGIS JS rotational renderer on a client-side feature layer — but geometry updates were treated as edit operations and required a painful promise chain. It wasn’t worth it.
So instead I used a graphics layer — which any simpler API like Leaflet (or Esri-Leaflet) could have handled.
CORS (Not Coors)
After hours struggling with CORS issues (including multiple failed CORS-Anywhere attempts), I discovered I could simply use JSONP.
Native fetch() doesn’t support JSONP, so I dusted off jQuery for the requests.
Cheers.
Open Data
I’m a big believer in OPEN DATA, and this application is a perfect example.
Huge thanks to the Washington State Department of Transportation for not only sharing data, but running a live, public API with real-time vessel locations and schedules.
Via API
As web GIS eats the custom geo-app world, the big missing piece is consuming external APIs. If you want dynamic data from multiple systems, you build it yourself — for now. I would genuinely love to be proven wrong someday.
WSDOT’s Traveler Information API (and specifically the State Ferries Vessels endpoint) made this whole project possible.