I am absolutely in love with the ferries in Washington State. When we lived there, we would often take a ferry ride as an outing with the kids. We’ve hauled our kids aboard every route in the system at least once. It is truly magical to glide across Puget Sound experiencing the salty air, looking for marine life (Orca!), and soaking in the sound of endless car alarms (if you’ve ridden, you know).
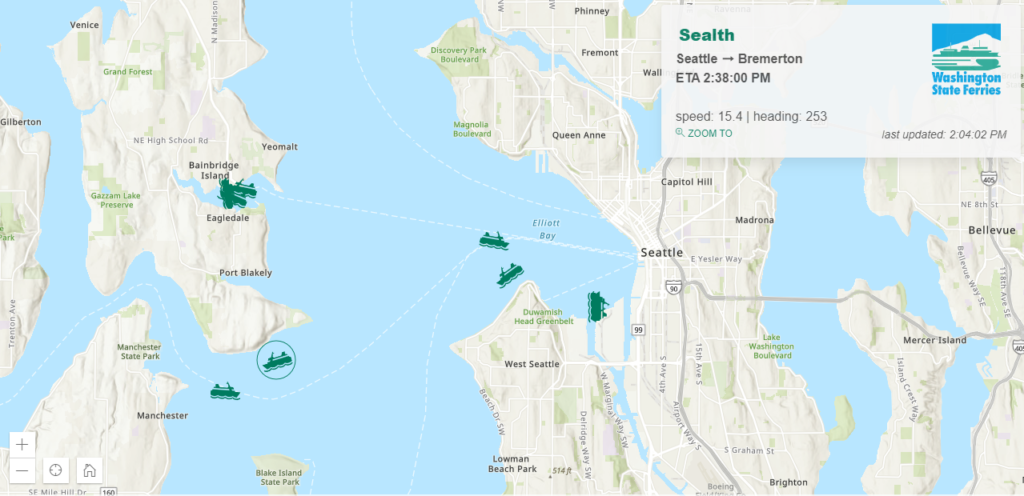
The application is what it says on the package, a web mapping application that shows real-time location and schedule details for individual vessels in the Washington State Ferry System. I consider 8 seconds to be real-time but I know there are sticklers. Locations update every 8 seconds and if you miss your boat due to an 8 second lag you are cutting things way too close my friend.

The Technical Stuff
If you want to dig right in:
CODE
https://github.com/BrightRainSolutions/wa-ferry-tracker
LIVE APP
https://brightrain.com/ferries/
The application was developed using:
- VUE JS
- ARCGIS JS API v4 (turned out to be the wrong choice, see below)
- JQuery (yeah jQuery, don’t @ me, it’s for requests, see below)
- BULMA
Vue is good. Vue is versatile. I can script tag it in the html doc and still use good ole html while getting all of the crispiness of a reactive component (and it works just fine to declare it within the required arcgis js AMD). No build process, not a bunch of dependencies, simple.
The structure and logic of the app is straight forward. The core is a graphics layers to display individual ferry locations – both position and attribute details get updated every x number of seconds. The first call to the vessel location API creates the graphics and adds them to the graphics layer. A timer is then set to call the function to update the ferries at a set interval (initially 8 seconds). On update, each vessel returned from the API is retrieved from the graphics layer and its position and heading are updated (icon updated according to heading). If a ferry is selected the info box displays the vessel route details. Bonus – when the update occurs, the info box displaying details for the ferry is seamlessly updated as well.
MOBILE
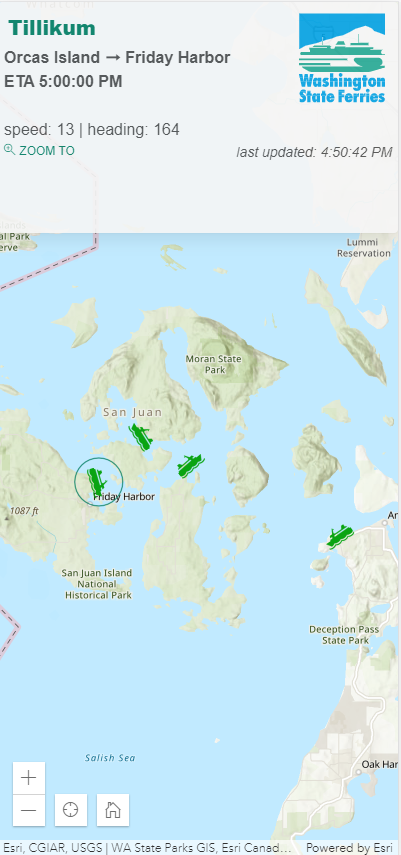
Making an interactive map mobile friendly is challenging to say the least but adding media queries to pin the info box to the top on device screens smaller than 600px provides a workable solution for tracking ferries on mobile devices including tablets and phones.

HEADING GRAPHIC
These are the funny things in real-life projects. I probably spent the most amount of time on the ferry graphics themselves. Since the API returns the heading of the vessel, obviously, we want to point it in the right direction with each update. So, the easiest icon to use would be an overhead view of a boat.

BUT, how boring!
I wanted to show an oblique ferry boat headed in the right direction. SO! In order to do this, I initially created 8 icons for eight possible headings (W, NW, NE, and so on) and then determined which to use based on the given heading (45° = NE):


BUT! Realized I could set the angle of the symbol with each position update which would produce a more accurate heading. BUT BUT! You guys….we could end up with upside down boats in certain headings if we used the same image for all headings like this one heading at 270°:

So, I settled on using two images, both pointing north, 0°, but in opposite orientations. This allows for any ferry traveling west, between headings 180 and 360, to use the ‘heading east’ symbol with the correct angle applied and not be upside down(!):


A function then determines which image to use based on heading. For example, if our heading is 45°, we use the ferry icon ‘heading east’ and then set the angle of the icon to 45

The function that is called when a ferry is updated to determine the symbol based on heading:
getFerryMarkerSymbol(heading) {
    // We have two icons defined in our data
    // one for ferrys heading west and another east
    // both oriented correctly
    // so determine which icon to use based on the heading
    // then set the angle of the icon and return it
    if (heading > 0 && heading <= 180) {
        this.ferryMarkers.headingEast.angle = heading;
        return this.ferryMarkers.headingEast;
    } else {
        this.ferryMarkers.headingWest.angle = heading;
        return this.ferryMarkers.headingWest;
 }}
It takes a certain amount of stubborn patience to work out these kind of UI details. But I am here for it.
THE WRONG TOOL
I am obsessed with using the right tool for the job (ask my daughter about my browbeating regarding which knife to use for which cutting job). I could have used a simpler mapping API. I was trying to take advantage of the rotational symbol renderer in a client-side feature layer within the arcgis js api, but the update process for feature geometry was incredibly cumbersome. Basically, the API treats each update as an edit and requiring a chain of promises to have it propagate to the actual feature location in the interface. So. I didn’t end up using a client-side feature layer that could actually use the rotational renderer and simply used a graphics layer. Which any simpler APIs could do, such as (esri-)leaflet.
CORS NOT COORS
After hours struggling with CORS issues with various attempts at implementing CORS Anywhere, I discovered I could use JSONP to make the request. However, the native fetch does not support jsonp, so I went with jQuery to make the jsonp request. Cheers!
OPEN DATA
I’m a big believer in OPEN DATA and this application is a great example. Big shout out to Washington State Department of Transportation for not only the data, but an active service that provides real time vessel locations and schedule details.
VIA API
As web GIS eats the custom geo application world, one holdout is consuming outside APIs for custom applications. If you want to include dynamic data from disparate systems you need to build it yourself, for now. And I remain open to being proven wrong here.
I discovered the Washington State Department of Transportation (WSDOT) Traveler Information API, which includes the specific State Ferries Vessels API, and went to work to develop the real-time-tracking because why? I just love the ferries.
Please open this on a ferry ride soon and let me know what you think!
