On this inaugural GIS Appreciation Day: Following great stories by Gretchen Peterson and Bill Dollins >
My Road to GIS
I am absolutely fascinated by the various paths that lead nerds of all types to GIS. From natural sciences, social sciences, science fiction, art, wanderers of all kinds stumble upon GIS and decide to stay. Me too. Some use it as a tool to further their pursuits, others make it their career. It blends so many worlds (pun intended) that it casts a wide net and yields an interesting haul. It certainly blended four perfect worlds for me: Sociology, The Great Outdoors, Maps, and Magic.
My road to GIS started with a simple question: What is your home zip code? Little did I know how this one question would affect not only my career, but my life.
My four worlds
First, I am absolutely fascinated by people and society. So naturally I studied Sociology. Initially I had little interest in technology outside of using a word processor to write my papers and print them (yes, dot matrix). I was a social worker helping homeless mentally ill people in my hometown for five years while I finished a two year college degree. I was an idealist who was certain to save the world.
Before that happened however…and before I thought my spirit would break…I split to Alaska to “Find Myself” and to experience the thrill and serenity of the Great Outdoors. I got my copy of The Milepost and a giant fistful of maps and headed to Alaska via the famous ALCAN Highway. Suffice it to say I learned how to effectively use and respect Maps in Alaska, among other things. When it was time to return to the Lower 48 I just couldn’t bring myself to move back to the midwest, so I moved to Colorado.
Upon moving to Colorado (the first time), I was thrilled to land a job with Colorado State Parks while finishing my degree in Sociology at Colorado State University. I was able to apply my new found quantitative research skills in conducting and reporting on the Colorado State Parks Visitation Study. In analyzing the results, one question seemed to jump off the page. What is your home zip code? Simple enough, but with so many possibilities. But I just didn’t know how to analyze it. I could have looked for recurrences of the same zip code in a table, but that misses so much. How could I display this data in a useful and interesting way? I started to ask around and stumbled into those sacred three letters for the very first time: G. I. S.
Intrigued, I got a shapefile of all zip codes in the US (from what seemed to be some kind of ogre who hung out in a dark corner of our Stalin-era Denver State Building hacking commands into a blinking cursor in a black box on a Unix workstation). I then figured out how to join this shapefile to my list of zip codes and the world was never the same for me again. I had created my very first data driven map. There I had it, the merging of all the things I loved in the world: Sociology, The Great Outdoors, and Maps!
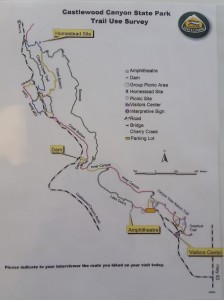
I quickly realized that what I had stumbled into was happening all around me at CSU. But not in the liberal arts college. I quickly signed up for my first GIS class and eventually earned a minor in Geography by conducting a comprehensive trail use study at Castlewood Canyon State Park that included everything from trail mapping with GPS to conducting personal interview surveys, compiling, and analyzing the results. And making maps of which trails hikers hiked.
In younger years I had very little interest in technology. In fact, I had a fascination with the Unabomber Manifesto decrying technology and its’ affects. But my encounter with GIS piqued my interest in technology enough to dig in a little. And with a proclamation from a GIS friend at the USGS that “Dude, if you’re going to do GIS you need to learn to code!” Dude, peeeeshaaw, was my reaction, as if he just insulted my first map. But, once I figured out how to control an entire stack of technology to make and control a map, it was Magic. And I was hooked on programming.
I have since made a career using all of these and all of them combine to keep me interested, engaged, and…well…employed. GIS is a journey that I couldn’t have planned for, but in the end, it fits so perfectly.
For giggles, although I still appreciate the simplicity, my first ‘published’ map:


